Nifty
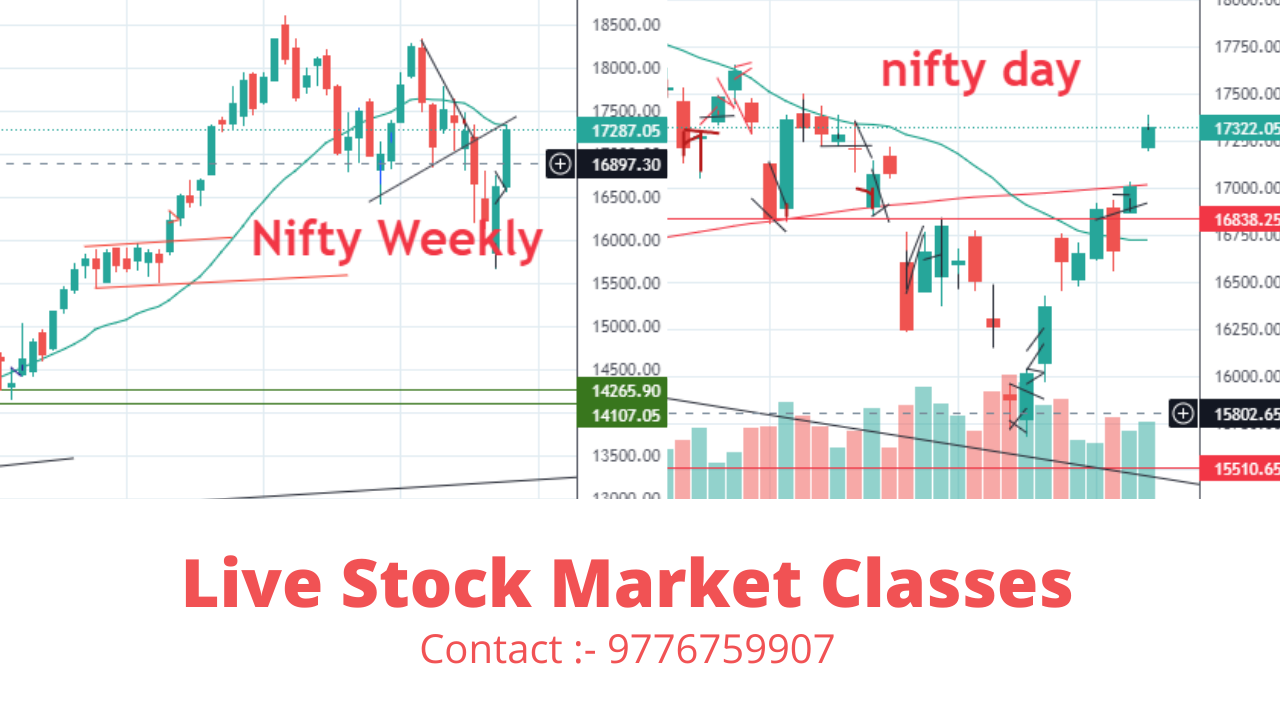
The nifty 50 Index has been moving upward for 2 weeks. It makes a low of 15671 weeks before last week, and now it makes a high of 17344. In these two weeks, investors have seen the journey from the fear of war to the victory of the BJP right now. The market sees a lot of gap up-opening and gap downs in these two weeks. Where nifty close above SMA of 200, on the other hand, weekly cadel close near below SMA 200. Here we may see a negative trade on tomorrow’s trading session. But It can be difficult to break SMA 200 daily candle. Here is the chance nifty will trade in between these two labels. Which are SMA 20 weekly 17278 and 200 SMA daily 17017.

Bank nifty
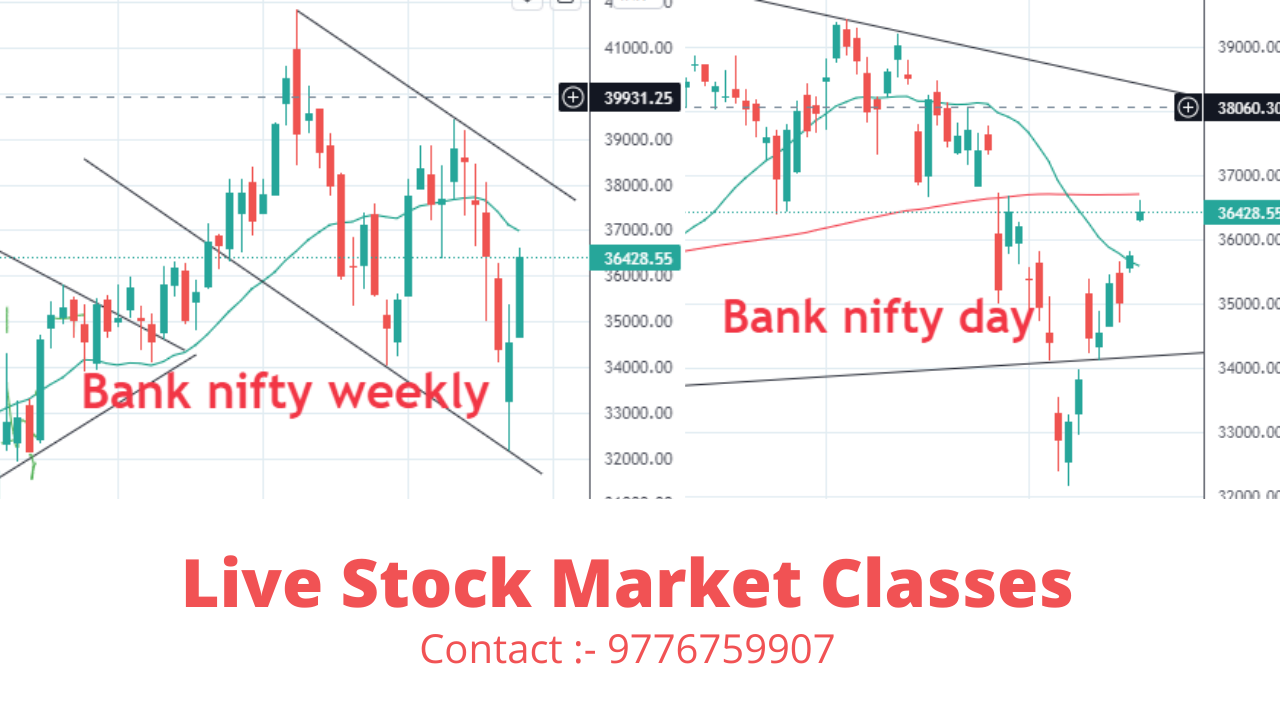
Bank nifty closes below the 200 SMA daily candle chart. And in the weekly candle chart, there is strong resistance at 37140. It is simple if the bank nifty breaks this it may go up to 38122 and 39424 levels this week.

We are expecting in this week’s market will trade in range bounds. If both indexes break the resistance then you will get to see a new high in this week of the coming week.


Helpful